Read about semantic segmentation, and instance segmentation.
The different evaluation metrics are used for different datasets/competitions. Most common are Pascal VOC metric and MS COCO evaluation metric.
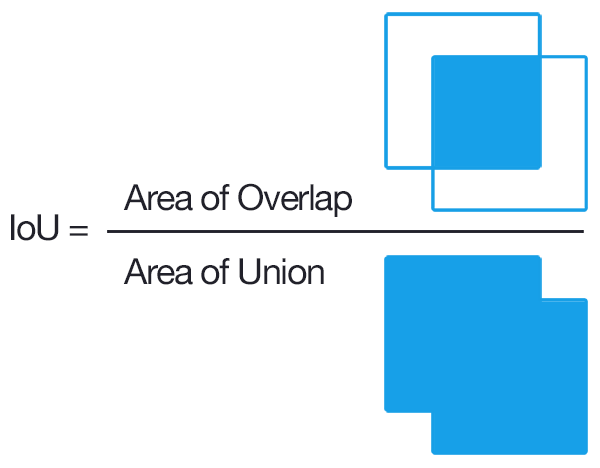
IoU (Intersection over Union)
To decide whether a prediction is correct w.r.t to an object or not, IoU or Jaccard Index is used. It is defines as the intersection b/w the predicted bbox and actual bbox divided by their union. A prediction is considered to be True Positive if IoU > threshold, and False Positive if IoU < threshold.
Precision and Recall
To understand mAP, let’s go through precision and recall first. Recall is the True Positive Rate i.e. Of all the actual positives, how many are True positives predictions. Precision is the Positive prediction value i.e. Of all the positive predictions, how many are True positives predictions. Read more in evaluation metrics for classification.
\[\text{Recall} = \frac{\text{TP}}{\text{TP} + \text{FN}} = \frac{\text{TP}}{\text{# ground truths}}\] \[\text{Precision} = \frac{\text{TP}}{\text{TP} + \text{FP}} = \frac{\text{TP}}{\text{# predictions}}\]mAP (mean Average Precision)
Pascal VOC
In order to calculate mAP, first, you need to calculate AP per class.
Consider the below images containing ground truths (in green) and bbox predictions (in red) for a particular class.
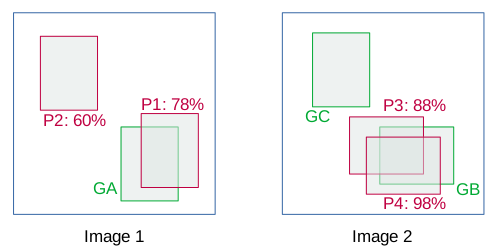
The details of the bboxes are as follows:
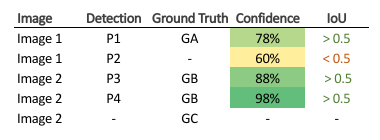
In this example, TP is considered if IoU > 0.5 else FP. Now, sort the images based on the confidence score. Note that if there are more than one detection for a single object, the detection having highest IoU is considered as TP, rest as FP e.g. in image 2.
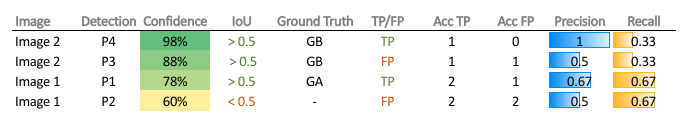
In VOC metric, Recall is defined as the proportion of all positive examples ranked above a given rank. Precision is the proportion of all examples above that rank which are from the positive class.
Thus, in the column Acc (accumulated) TP, write the total number of TP encountered from the top, and do the same for Acc FP. Now, calculate the precision and recall e.g. for P4, Precision = 1/(1+0) = 1, and Recall = 1/3 = 0.33.
These precision and recall values are then plotted to get a PR (precision-recall) curve. The area under the PR curve is called Average Precision (AP). The PR curve follows a kind of zig-zag pattern as recall increases absolutely, while precision decreases overall with sporadic rises.
The AP summarizes the shape of the precision-recall curve, and, in VOC 2007, it is defined as the mean of precision values at a set of 11 equally spaced recall levels [0,0.1,…,1] (0 to 1 at step size of 0.1), not the AUC.
\[AP = \frac{1}{11} \sum_{r \in (0,0.1,...,1)}{p_{interp(r)}}\]The precision at each recall level r is interpolated by taking the maximum precision measured for a method for which the corresponding recall exceeds r.
\[p_{interp(r)} = \max_{\tilde{r}:\tilde{r}\geq r}{p(r)}\]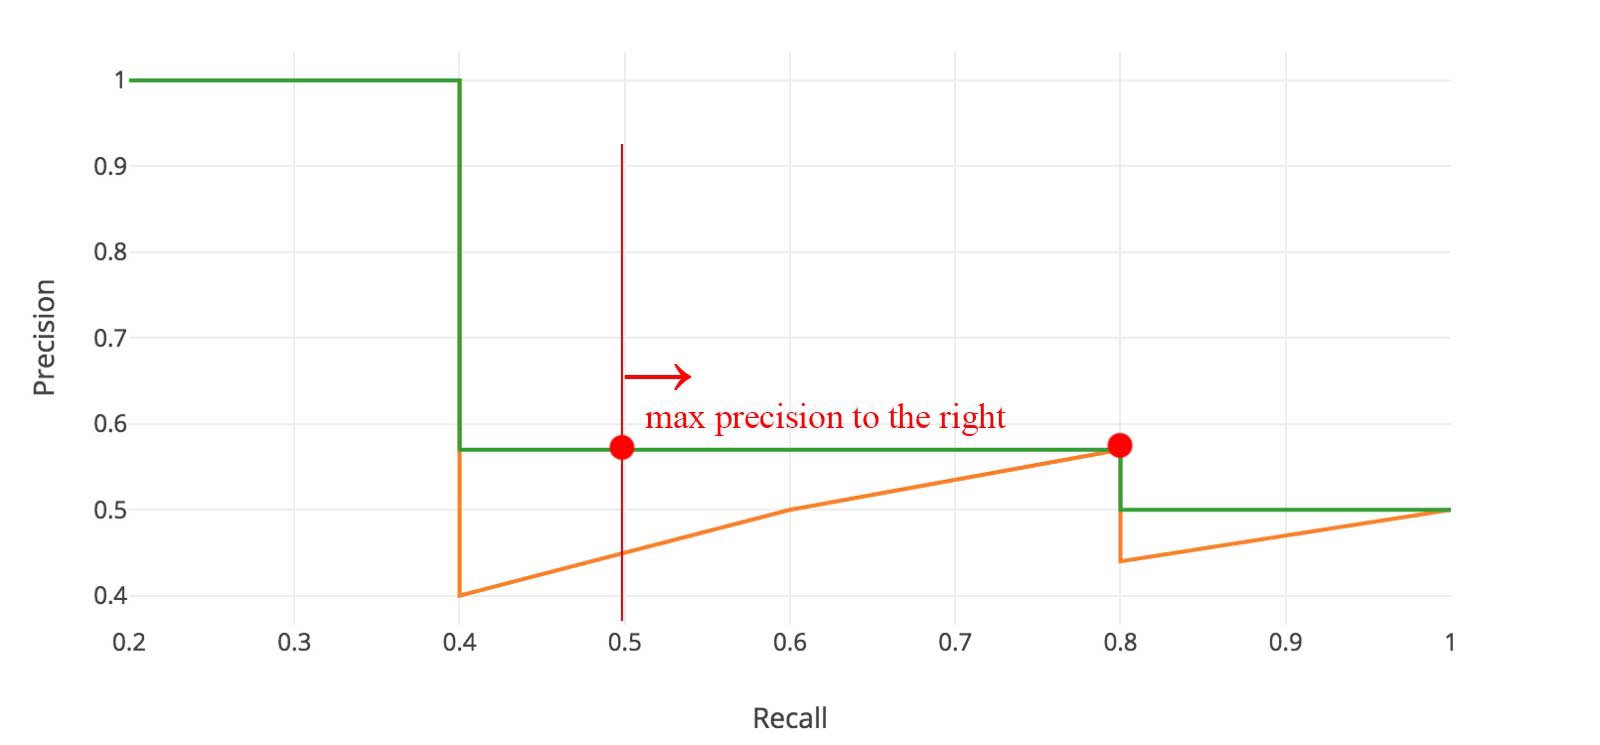
i.e. take the max precision value to the right at 11 equally spaced recall points [0: 0.1: 1], and take their mean to get AP.
However, from VOC 2010, the computation of AP changed.
Compute a version of the measured precision-recall curve with precision monotonically decreasing, by setting the precision for recall r to the maximum precision obtained for any recall \(\tilde{r}\geq r\). Then compute the AP as the area under this curve by numerical integration.
i.e. given the PR curve in orange, calculate the max precision to the right for all the recall points thus getting a new curve in green. Now, take the AUC using integration under the green curve. It would be the AP. The only difference from VOC 2007 here is that we’re taking not just 11 but all the points into account.
Now, we have AP per class (object category), mean Average Precision (mAP) is the averaged AP over all the object categories.

For the segmentation challenge in VOC, the segmentation accuracy (per-pixel accuracy calculated using IoU) is used as the evaluation criterion, which is defined as follows:
\[\text{segmentation accuracy} = \frac{\text{TP}}{\text{TP + FP + FN}}\]COCO
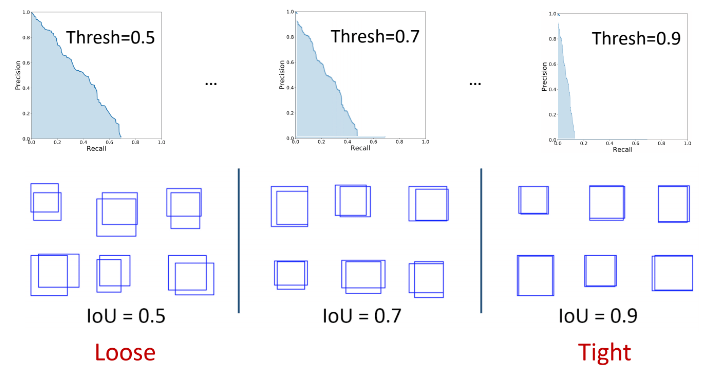
Usually, as in VOC, a prediction with IoU > 0.5 is considered as True Positive prediction. It means that two predictions of IoU 0.6 and 0.9 would have equal weightage. Thus, a certain threshold introduces a bias in the evaluation metric. One way to solve this problem is to use a range of IoU threshold values, and calculate mAP for each IoU, and take their average to get the final mAP.
Note that COCO uses [0:.01:1] R=101 recall thresholds for evaluation.
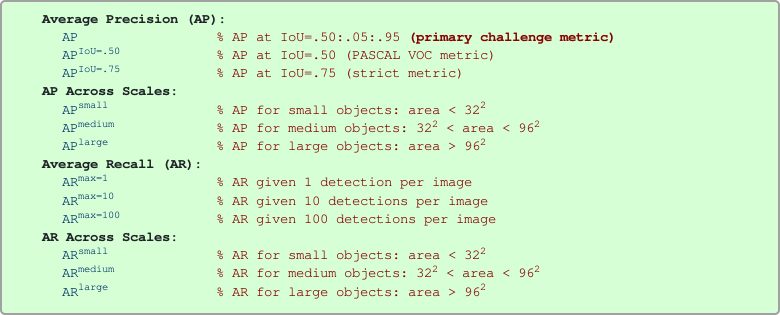
In COCO evaluation, the IoU threshold ranges from 0.5 to 0.95 with a step size of 0.05 represented as AP@[.5:.05:.95].
The AP at fixed IoUs such as IoU=0.5 and IoU=0.75 is written as AP50 and AP75 respectively.
\[mAP_{\text{COCO}} = \frac{mAP_{0.50} + mAP_{0.55} + ... + mAP_{0.95}}{10}\]Unless otherwise specified, AP and AR are averaged over multiple Intersection over Union (IoU) values. Specifically we use 10 IoU thresholds of .50:.05:.95. This is a break from tradition, where AP is computed at a single IoU of .50 (which corresponds to our metric \(AP^{IoU=.50}\)). Averaging over IoUs rewards detectors with better localization.
AP is averaged over all categories. Traditionally, this is called “mean average precision” (mAP). We make no distinction between AP and mAP (and likewise AR and mAR) and assume the difference is clear from context.
Two minute additions: Usually, the averages are taken in a different order (the final result is same), and in COCO, mAP is also referred to as AP i.e.
- Step 1: For each class, calculate AP at different IoU thresholds and take their average to get the AP of that class.
- Step 2: Calculate the final AP by averaging the AP over different classes.
AP is in fact an average, average, average precision.
Conclusion
- PascalVOC2007 uses 11 Recall points on PR curve.
- PascalVOC2010–2012 uses (all points) Area Under Curve (AUC) on PR curve.
- MS COCO uses 101 Recall points on PR curve as well as different IoU thresholds.
References & Further Readings:

Comments