A false positive error or false positive (false alarm) is a result that indicates a given condition exists when it doesn’t.
Confusion Matrix
You can get the number of false positives from the confusion matrix. For a binary classification problem, it is described as follows:
| Predicted = 0 | Predicted = 1 | Total | |
|---|---|---|---|
| Actual = 0 | True Negative (TN) | False Positive(FP) | N |
| Actual = 1 | False Negative (FN) | True Positive (TP) | P |
| Total | N * | P * |
In statistical hypothesis testing, the false positive rate is equal to the significance level, \(\alpha\), and \(1 - \alpha\) is defined as the specificity of the test. Complementarily, the false negative rate is given by \(\beta\).
Metrics
The different measures for classification are:
| Name | Definition | Synonyms |
|---|---|---|
| False positive rate (\(\alpha\)) | FP/N | Type I error, 1- specificity |
| True Positive rate (\(1-\beta\)) | TP/P | 1 - Type II error, power, sensitivity, recall |
| Positive prediction value | TP/P* | Precision |
| Negative prediction value | TN/N* | |
| Sensitivity / Recall | TP/P | True Positive Rate, hit rate |
| Specificity | TN/N | True Negative Rate |
| Overall accuracy | (TN + TP)/N | |
| Overall error rate | (FP + FN)/N | |
| F1 Score | 2TP/(2TP + FP + FN) | Harmonic mean of precision and recall |
| Balanced Accuracy | (TP/P + TN/N) / 2 | Average of sensitivity and specificity |
For example, in cancer detection, sensitivity and specificity are the following:
- Sensitivity: Of all the people with cancer, how many were correctly diagnosed?
- Specificity: Of all the people without cancer, how many were correctly diagnosed?
And precision and recall are the following:
- Recall: Of all the people who have cancer, how many did we diagnose as having cancer?
- Precision: Of all the people we diagnosed with cancer, how many actually had cancer?
To summarize the intuition behind each metric:
| Metric | It answers | Focus |
|---|---|---|
| Precision | Of all positive predictions, how many were correct? | Minimizing false positives |
| Recall / Sensitivity | Of all actual positives, how many did we catch? | Minimizing false negatives |
| Specificity | Of all actual negatives, how many did we correctly identify? | Minimizing false positives |
Precision is about being correct when you say “yes”. Recall is about not missing the actual “yes” cases.
When to Choose Precision vs Recall
Which metric you prioritize depends on the cost of different types of errors:
Choose Precision when the cost of false positives is high. A model with high precision but low recall is very accurate when it predicts a positive instance, but it may miss many actual positives.
- Example (Spam detection): A false positive (marking a legitimate email as spam) can cause important emails to be missed. You want high precision to ensure only actual spam is flagged.
- Example (Fraud detection): Investigating a false positive is costly. High precision ensures flagged transactions are likely fraudulent, saving investigation resources.
Choose Recall when the cost of false negatives is high. A model with high recall but low precision identifies most actual positives, but it may also produce many false positives.
- Example (Medical diagnosis): Missing a positive case (e.g., a patient with a disease) can have severe consequences. High recall ensures most patients with the disease are identified.
- Example (Security screening): Missing a threat (e.g., a weapon in baggage scan) is unacceptable. High recall is necessary to catch all threats.
Imbalanced Datasets
Most evaluation metrics behave differently when class distributions are skewed. Accuracy, in particular, can be misleading, a model that predicts the majority class for every sample can achieve high accuracy while completely failing on the minority class.
In imbalanced settings, metrics like precision, recall, F1, and PR-AUC give a more reliable picture of model performance than raw accuracy.
Threshold Selection
Often, we want to make binary prediction e.g. in predicting the quality of care of the patient in the hospital, whether the patient receive poor care or good care? We can do this using a threshold value \(t\).
- if \(P(poor care = 1) \geq t\), predict poor quality
- if \(P(poor care = 1 < t\), predict good quality
Now, the question arises, what value of \(t\) we should consider.
- if \(t\) is large, the model will predict poor care rarely hence detect patients receiving the worst care.
- if \(t\) is small, the model will predict good care rarely hence detect all patients receiving poor care.
i.e.
- A model with a higher threshold will have a lower sensitivity and a higher specificity.
- A model with a lower threshold will have a higher sensitivity and a lower specificity.
Thus, the answer to the above question depends on what problem you are trying to solve. With no preference between the errors, we normally select \(t = 0.5\).
ROC-AUC
Area Under the ROC Curve gives the AUC score of a model. AUC has several useful properties:
- Scale-invariant: It measures how well predictions are ranked rather than their absolute values.
- Classification-threshold-invariant: It evaluates the quality of predictions irrespective of which threshold is chosen.
- An AUC of 0.5 suggests no discriminative power (random guessing), while an AUC of 1.0 indicates perfect separation.
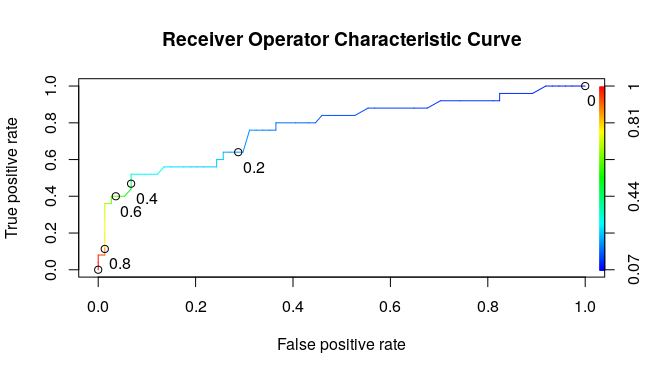
- The threshold of 1 means that the model will not catch any poor care cases, or have sensitivity of 0 but it’ll correctly label all the good care cases, meaning that you have a false positive rate of 0.
- The threshold of 0 means that the model will catch all of the poor care cases or have a sensitivity of 1, but it’ll label all of the good care cases as poor care cases too, meaning that you’ll have a false positive rate of 1.
Precision-Recall Curve
While ROC-AUC is a great general-purpose metric, it can be misleading for highly imbalanced datasets. Because true negatives dominate the false positive rate calculation, the ROC curve can appear overly optimistic even when the model performs poorly on the minority class.
The Precision-Recall (PR) curve plots precision against recall at various thresholds and provides a more informative picture for imbalanced datasets. A high area under the PR curve represents both high recall and high precision, meaning the model correctly identifies positive instances without producing excessive false positives.
Choosing the Right Metric
| Metric | When to Use |
|---|---|
| Accuracy | When classes are balanced and errors have symmetric costs. |
| Precision | When false positives are costly (spam detection, fraud investigation). |
| Recall | When false negatives are costly (medical diagnosis, security screening). |
| F1 Score | When you need a single balance between precision and recall. |
| ROC-AUC | When comparing classifiers, especially when ranking quality matters. |
| PR-AUC | When dealing with imbalanced datasets where the minority class is critical. |
Below is xkcd comic regarding the wrong interpretation of p-value and false positives.

References:
Comments