Scaling vs Normalization
Friday, March 23, 20185 mins read
Feature scaling (also known as data normalization) is the method used to standardize the range of features of data. Since, the range of values of data may vary widely, it becomes a necessary step in data preprocessing while using machine learning algorithms.
Scaling
In scaling (also called min-max scaling), you transform the data such that the features are within a specific range e.g. [0, 1].
\[x' = \frac{x - x_{min}}{x_{max} - x_{min}}\]where x’ is the normalized value.
Scaling is important in the algorithms such as support vector machines (SVM) and k-nearest neighbors (KNN) where distance between the data points is important. For example, in the dataset containing prices of products; without scaling, SVM might treat 1 USD equivalent to 1 INR though 1 USD = 65 INR.
import numpy as np
import seaborn as sns
import matplotlib.pyplot as plt
from sklearn.preprocessing import minmax_scale, scale

# set seed for reproducibility
np.random.seed(0)

# generate random data points from an exponential distribution
x = np.random.exponential(size=1000)

# mix-max scaling
scaled_data = minmax_scale(x)
# scaled_data = (x-x.min())/(x.max()-x.min())

# plot both together to compare
f, ax = plt.subplots(1,2)
sns.distplot(x, ax=ax[0], color='y')
ax[0].set_title("Original data")
sns.distplot(scaled_data, ax=ax[1], color='g')
ax[1].set_title("Scaled data")
plt.show()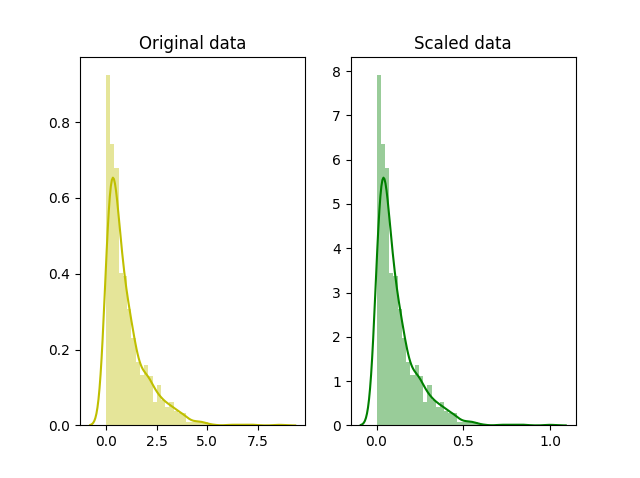
Normalization and Standardization
The point of normalization is to change your observations so that they can be described as a normal distribution.
Normal distribution (Gaussian distribution), also known as the bell curve, is a specific statistical distribution where a roughly equal observations fall above and below the mean, the mean and the median are the same, and there are more observations closer to the mean.

Note: The above definition is as per statistics. There are various types of normalization. In fact, min-max scaling can also be said to a type of normalization. In machine learning, the following are most commonly used.
#1
Standardization (also called z-score normalization) transforms your data such that the resulting distribution has a mean of 0 and a standard deviation of 1. It’s the definition that we read in the last paragraph.
\[x' = \frac{x - x_{mean}}{\sigma}\]where x is the original feature vector, \(x_{mean}\) is the mean of that feature vector, and σ is its standard deviation.
The z-score comes from statistics, defined as
\[z = \frac{x - \mu}{\sigma}\]
where \(\mu\) is the mean. By subtracting the mean from the distribution, we’re essentially shifting it towards left or right by amount equal to mean i.e. if we have a distribution of mean 100, and we subtract mean 100 from every value, then we shift the distribution left by 100 without changing its shape. Thus, the new mean will be 0. When we divide by standard deviation \(\sigma\), we’re changing the shape of distribution. The new standard deviation of this standardized distribution is 1 which you can get putting the new mean, \(\mu = 0\) in the z-score equation.
It’s widely used in SVM, logistics regression and neural networks.
# standardization
standardized_data = scale(x)

# plot
fig, ax=plt.subplots(1,2)
sns.distplot(x, ax=ax[0], color='y')
ax[0].set_title("Original data")
sns.distplot(standardized_data, ax=ax[1], color='teal')
ax[1].set_title("Standardized data")
plt.show()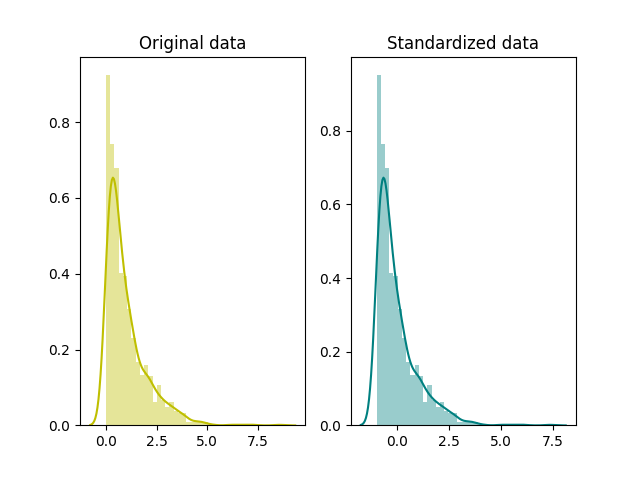
#2
Simply called normalization, it’s just another way of normalizing data. Note that, it’s a different from min-max scaling in numerator, and from z-score normalization in the denominator.
\[x' = \frac{x - x_{mean}}{x_{max} - x_{min}}\]# normalization
normalized_data = (x-x.mean())/(x.max()-x.min())
# plot
fig, ax=plt.subplots(1,2)
sns.distplot(x, ax=ax[0], color='y')
ax[0].set_title("Original data")
sns.distplot(normalized_data, ax=ax[1])
ax[1].set_title("Normalized data")
plt.show()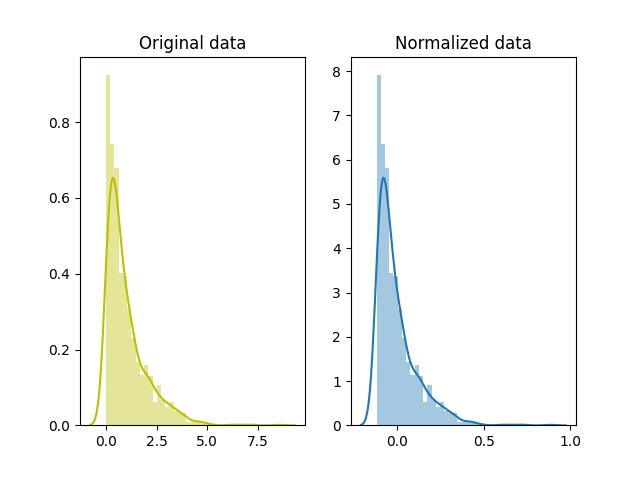
You need to normalize our data if you’re going use a machine learning or statistics technique that assumes that data is normally distributed e.g. t-tests, ANOVAs, linear regression, linear discriminant analysis (LDA) and Gaussian Naive Bayes.
Applications
In stochastic gradient descent, feature scaling can sometimes improve the convergence speed of the algorithm. In support vector machines, it can reduce the time to find support vectors.
Further Readings: