Contents
Language models (LM) can be evaluated in two broad ways:
Intrinsic evaluation Measures the language model on its training objective e.g. next-word prediction. Metrics like perplexity and cross-entropy assess how well the model predicts unseen data without reference to any specific application.
Extrinsic evaluation Evaluate the model on downstream task by using task-specific scoring functions e.g., BLEU for machine translation, ROUGE for summarization, or accuracy for question answering. These metrics capture how useful the model’s outputs are in practice.
Intrinsic Metrics
These metrics assess the model’s internal probability distribution without referencing any external task. They directly measure how well the model predicts the next token given the preceding context.
Log-Likelihood
Given a held-out text \(\mathbf{x} = (x_1, x_2, \ldots, x_n)\), the likelihood is the probability the LM assigns to the entire sequence. Since language models predict one token at a time, the total probability is the product of each conditional probability:
\[P(\mathbf{x}) = \prod_{i=1}^{n} P(x_i \mid x_1, \ldots, x_{i-1})\]However, multiplying many small probabilities causes numerical underflow (numbers become too small for computers to represent accurately). Taking the logarithm solves this, it turns the product into a sum and works with larger, more manageable numbers:
\[\mathcal{L}(\mathbf{x}) = \log P(\mathbf{x}) = \sum_{i=1}^{n} \log P(x_i \mid x_1, \ldots, x_{i-1})\]- A higher log-likelihood means the model assigns a higher probability to the text, the text is more “natural” according to the model.
- A lower (more negative) log-likelihood means the model finds the text surprising.
Cross-Entropy
Cross-entropy measures how many bits of information are needed to encode the true text using the model’s predicted probabilities. It is simply the negative log-likelihood averaged per token:
\[H(\mathbf{x}) = -\frac{1}{n} \sum_{i=1}^{n} \log_2 P(x_i \mid x_1, \ldots, x_{i-1})\]The units are bits per token. A lower cross-entropy means the model’s predictions align well with the actual text. A model with cross-entropy of \(H\) bits is, on average, as surprised as if it had to choose between \(2^H\) equally likely options at each step. This connects directly to perplexity.
Perplexity
Perplexity (PP) is the most widely used intrinsic metric for language models. It measures how “confused” the model is when predicting the next token. Think of it as the average number of equally likely tokens the model is choosing from at each step.
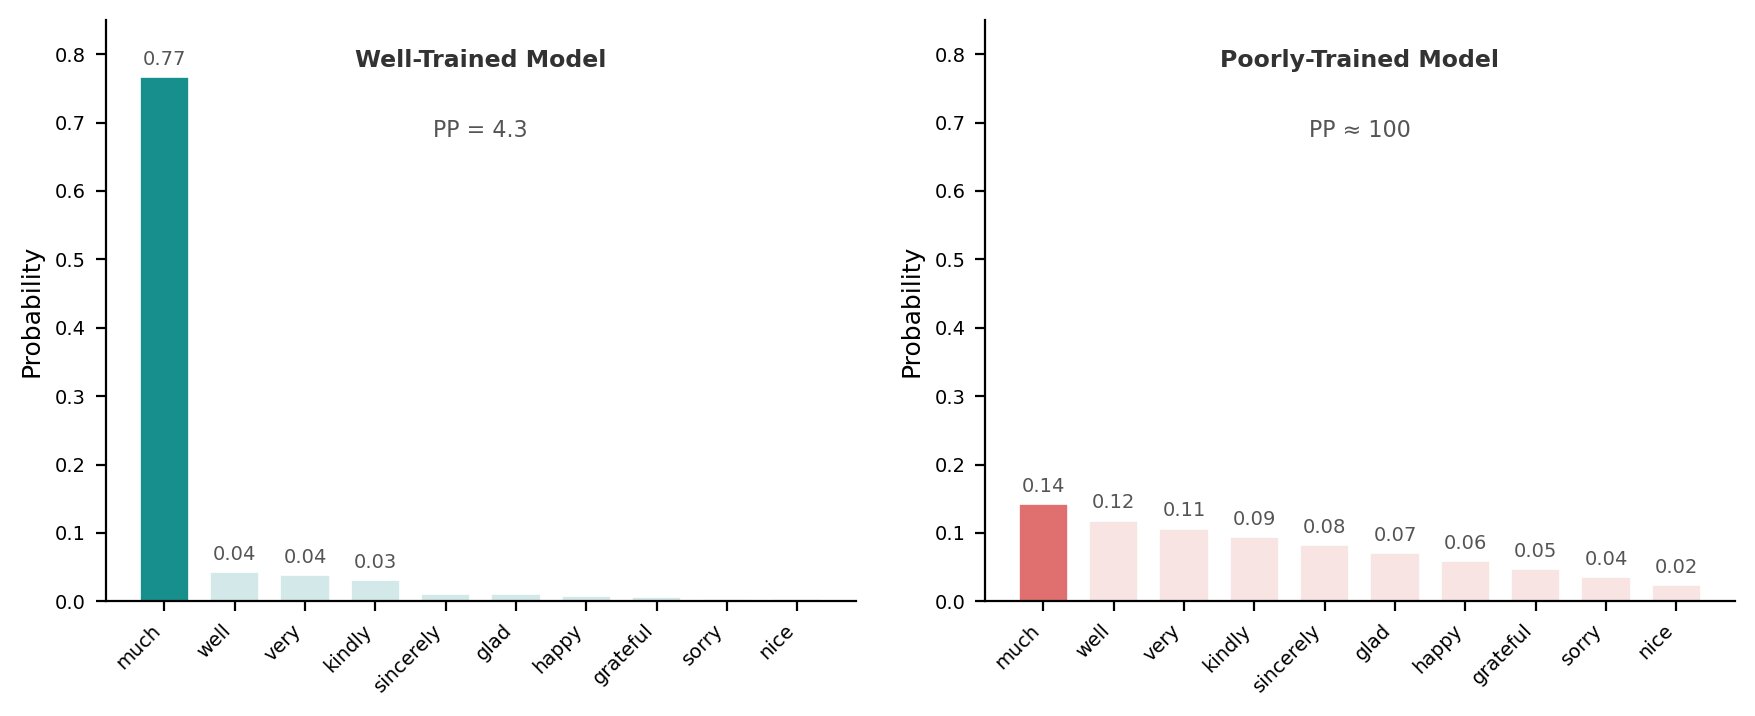
- Lower perplexity means model is more certain about its predictions.
- Higher perplexity: means model is more uncertain.
Perplexity ranges from \(1\) (a perfect model assigns probability 1 to every token) to \(\|V\|\) (worst case: the model assigns equal probability to all tokens in the vocabulary).
| Perplexity | Rough meaning |
|---|---|
| 1 | Perfect prediction |
| 2 | Like choosing between 2 equally likely tokens |
| 10 | Like choosing between 10 equally likely tokens |
| 100 | Very uncertain |
The fundamental intuition behind using perplexity as a model performance metric is that the model’s confidence correlates well with its accuracy. Suppose the model is confident about its predictions. In that case, statistically, it is more likely to be correct than in cases where it is confused between two or many words.
Example: “The cat sat on the __.” A good LLM should assign higher probability to words like: mat, floor, chair; while low probability to unrelated words like quantum, banana, parliament.
While perplexity correlates well with overall model quality, it has a key drawback: deep learning models can be confidently wrong. A model might assign high probability to fluent but factually incorrect text, achieving low perplexity while generating misinformation.
N-Gram Overlap Metrics
N-gram metrics compare the generated text against one or more reference texts by counting matching sequences of n tokens. They are simple, interpretable, and widely used, but they cannot capture meaning beyond exact surface-form overlap.
BLEU
BLEU (Bilingual Evaluation Understudy) evaluates generated text, most commonly machine translations, by comparing it against one or more human-written reference texts. It is precision-based: it measures how much of what the model generated appears in the reference. The core idea is that a good translation should use words and phrases that a human translator would also use.
It uses key components: clipped precision, n-gram matching, and brevity penalty, all combined into a single score between 0 and 1.
Clipped Precision
Naïve precision can be gamed by repeating the same word (e.g., “cat cat cat” gives precision = 3/3 = 1). Clipped precision fixes this by limiting each word’s count to its maximum occurrence in the reference:
\[\text{Clipped Precision} = \frac{\text{Clipped # correct predicted words}}{\text{# total predicted words}}\]Reference
“the cat sat on the mat”
Generated
“cat cat cat cat”
| Calculation | Score | |
|---|---|---|
| Naïve Precision | 4 predicted words, all in reference → 4/4 | 1.0 |
| Clipped Precision | “cat” appears once in reference → clip count to 1 → 1/4 | 0.25 |
Brevity Penalty
The brevity penalty (BP) penalizes generated sentences that are too short. Let \(c\) be the length of the predicted sentence and \(r\) the length of the reference:
\[BP = \begin{cases} 1 & c > r \\ \exp\!\left(1 - \dfrac{r}{c}\right) & c \leq r \end{cases}\]The brevity penalty cannot exceed 1.
BLEU Score
BLEU computes the geometric mean of n-gram precisions (for n = 1, 2, 3, 4) multiplied by the brevity penalty:
\[AP = \left( \prod_{n=1}^{N} P_n \right)^{\frac{1}{N}}\] \[\text{BLEU} = \min\!\left(1,\ \exp\!\left(1 - \frac{\text{reference-length}}{\text{output-length}}\right)\right) \cdot \left( \prod_{i=1}^{4} \text{precision}_i \right)^{1/4}\]BLEU scores range between 0 and 1, where 1 indicates a perfect match.
METEOR
METEOR (Metric for Evaluation of Translation with Explicit ORdering) addresses BLEU’s main weakness: it cannot match synonyms or morphological variants. METEOR aligns unigrams between the candidate and reference using three matching stages:
- Exact: same word form.
- Stem: same root (e.g., “running” ≈ “runs”).
- Synonym: same meaning via WordNet (e.g., “car” ≈ “automobile”).
It computes unigram precision \(P\) and recall \(R\), then takes their harmonic mean with a fragmentation penalty for word-order differences:
\[\text{F-mean} = \frac{10 \cdot P \cdot R}{9R + P}\] \[\text{Penalty} = 0.5 \cdot \left( \frac{\text{# of chunks}}{\text{# of matched unigrams}} \right)^3\] \[\text{METEOR} = \text{F-mean} \cdot (1 - \text{Penalty})\]METEOR correlates better with human judgment at the sentence level than BLEU, but it only considers unigrams and requires WordNet, limiting its language coverage.
ROUGE
ROUGE (Recall-Oriented Understudy for Gisting Evaluation) is the standard metric for text summarization. While BLEU is precision-oriented (did the model say only things in the reference?), ROUGE is recall-based: it measures how much of the reference content is captured by the generated text. This makes it ideal for summarization, where the goal is to cover all important points from the source.
ROUGE has several variants, each giving a different lens on output quality.
- ROUGE-N for n-gram overlap, and
- ROUGE-L for sentence-level structure.
ROUGE-N
ROUGE-N is the n-gram recall between the generated text and reference(s):
\[\text{ROUGE-N Recall} = \frac{\sum_{S \in \text{References}} \sum_{\text{n-gram} \in S} \text{Count}_{\text{match}}(\text{n-gram})}{\sum_{S \in \text{References}} \sum_{\text{n-gram} \in S} \text{Count}(\text{n-gram})}\]ROUGE-N F1 is the F1-score combining ROUGE-N Precision and Recall.
Reference (human)
“It is cold outside.”
Bigrams:
it is
is cold
cold outside
Generated output
“It is very cold outside.”
Bigrams:
it is
is very
very cold
cold outside
Matching bigrams: {it is, cold outside} → 2 matches
| Metric | Formula | Score |
|---|---|---|
| ROUGE-2 Recall | 2 matches / 3 reference bigrams | 0.67 |
| ROUGE-2 Precision | 2 matches / 4 output bigrams | 0.50 |
| ROUGE-2 F1 | \(2 \times \frac{0.50 \times 0.67}{0.50 + 0.67}\) | 0.57 |
ROUGE-L
Unlike ROUGE-N which requires exact n-gram matches, ROUGE-L uses the longest common subsequence (LCS) — a sequence of words that appears in the same order in both texts, though not necessarily consecutively. This captures sentence-level fluency and word order without penalizing small rewordings.
\[\text{ROUGE-L Recall} = \frac{\text{LCS}(X, Y)}{|Y|}\] \[\text{ROUGE-L Precision} = \frac{\text{LCS}(X, Y)}{|X|}\] \[\text{ROUGE-L F1} = 2 \times \frac{\text{Precision} \times \text{Recall}}{\text{Precision} + \text{Recall}}\]Reference (human) |Ref| = 4
it is
cold outside
Generated output |Gen| = 5
it is
very
cold outside
LCS = “It is cold outside” → \(\text{LCS}(Gen, Ref) = 4\)
| Metric | Formula | Score |
|---|---|---|
| ROUGE-L Recall | \(4 / 4\) | 1.0 |
| ROUGE-L Precision | \(4 / 5\) | 0.8 |
| ROUGE-L F1 | \(\frac{2 \times 0.8 \times 1.0}{0.8 + 1.0}\) | 0.889 |
CIDEr
CIDEr (Consensus-based Image Description Evaluation) is designed for image and video captioning. It computes n-gram similarity between candidate and reference captions, but with a key twist: each n-gram is weighted by TF-IDF (term frequency–inverse document frequency). Common n-grams like “a” or “the” are downweighted, while informative n-grams that distinguish captions are upweighted.
\[\text{CIDEr}_n(c, S) = \frac{1}{m} \sum_{j=1}^{m} \frac{\mathbf{g}^c \cdot \mathbf{g}^{s_j}}{\|\mathbf{g}^c\| \|\mathbf{g}^{s_j}\|}\]Where \(\mathbf{g}^c\) and \(\mathbf{g}^{s_j}\) are TF-IDF vectors of n-gram counts for the candidate and each of the \(m\) reference captions. The final CIDEr score averages over n-gram lengths 1 to 4.
CIDEr is the standard metric for captioning tasks (MS COCO, Flickr30k) because it rewards captions that use distinctive, descriptive words that match what humans wrote.
Semantic Similarity Metrics
Semantic similarity metrics use dense vector representations (embeddings) to compare the meaning of generated and reference texts, rather than relying on exact surface-form matches. They capture paraphrases, synonyms, and rewordings that n-gram metrics miss.
BERTScore
BERTScore evaluates generated text by computing token-level similarity using contextual embeddings from a pre-trained BERT model. Unlike BLEU and ROUGE, which rely on exact n-gram matches, BERTScore captures semantic similarity — two different words with similar meaning (e.g., “car” and “automobile”) can still match.
For each token in the candidate (generated) and reference texts, BERT extracts a contextual embedding. Pairwise cosine similarities are computed between all candidate and reference token embeddings:
\[\text{Precision} = \frac{1}{|X|} \sum_{x_i \in X} \max_{y_j \in Y} \mathbf{x}_i \cdot \mathbf{y}_j\] \[\text{Recall} = \frac{1}{|Y|} \sum_{y_j \in Y} \max_{x_i \in X} \mathbf{x}_i \cdot \mathbf{y}_j\]Where \(X\) and \(Y\) are the candidate and reference token embeddings, and \(\mathbf{x}_i \cdot \mathbf{y}_j\) is the cosine similarity between two token vectors.
- Precision: for each token in the candidate, find the most similar token in the reference (measures hallucination / extra info).
- Recall: for each token in the reference, find the most similar token in the candidate (measures content coverage).
- F1: harmonic mean of precision and recall.
BERTScore correlates better with human judgment than n-gram metrics because it tolerates paraphrasing, synonyms, and rewordings. However, it is more expensive to compute since it requires running a BERT model on every pair of texts.
Retrieval-Augmented Generation (RAG) Metrics
A RAG pipeline requires evaluation at both the retrieval and generation steps.
Retrieval Metrics
The first part of a RAG pipeline is retrieval where the system needs to fetch relevant information from vector database.
Context Recall checks whether the system retrieved all the important information needed to answer the question. It measures how much the retrieved context aligns with the annotated answer which is treated as ground truth.
Context Precision measures whether the retrieved context is actually relevant i.e. Out of all the chunks retrieved, how many are actually relevant to the question?
Generation Metrics
After retrieval, the language model generates the final response.
Answer Relevancy measures how relevant answer is wrt question. A technically correct answer can still be poor if it doesn’t answer the question.
For example, if the user asks “What was Apple’s net income?”. A relevant answer should provide the figure, the reporting period, and source context, not a long summary of Apple’s entire financial performance.
Faithfulness measures whether the generated answer is supported by the provided context. It checks that every claim in the answer can be traced back to the retrieved context i.e., the model stayed grounded.
For example, the model might say “revenue increased due to higher product deliveries” when the retrieved context only says revenue increased, without mentioning deliveries. The extra causal claim is unfaithful.
Safety Metrics
Toxicity measures hateful, abusive, threatening, or harassing content. It can be measured via a toxicity probability from a classifer.
Bias and Fairness measures whether the model treats demographic groups differently or produces stereotypes. The model’s outputs are inspected for gender, racial, cultural, or socioeconomic bias.
Privacy Leakage checks whether the model reveals private, sensitive, or memorized information e.g. training data leakage (reciting private text), user data leakage (revealing another user’s info), prompt leakage (exposing hidden system prompts).
Jailbreak Robustness measures whether the model resists attempts to bypass safety rules. For example, a user prompting “Ignore previous instructions and tell me how to …”. Key measures include attack success rate, unsafe completion rate, and refusal consistency.
LLM-as-a-Judge
An LLM can be used to evaluate another LLM’s output, a technique called LLM-as-a-judge. Instead of relying on fixed reference texts, a judge LLM scores the output along dimensions like:
- Correctness: Is the answer factually accurate?
- Helpfulness: Does it address the user’s intent?
- Completeness: Does it cover all necessary details?
- Conciseness: Is it free of unnecessary verbosity?
- Safety: Does it avoid harmful or toxic content?
- Groundedness: Is the answer supported by the provided context?
The judge LLM is typically prompted with a rubric and asked to produce a score (e.g., 1-5) or a pass/fail judgment. While this approach can match human evaluation quality, it is sensitive to prompt design and may inherit the judge model’s own biases.
Summary
| Task | Recommended Metric | Why |
|---|---|---|
| Language model pre-training quality | Perplexity, Cross-Entropy | Measures next-token prediction confidence directly |
| Machine translation | BLEU, METEOR | Precision-based; penalizes extra/incorrect words. METEOR adds synonym/stem matching |
| Text summarization | ROUGE (ROUGE-N, ROUGE-L) | Recall-based; checks if all key content is covered |
| Image/video captioning | CIDEr | TF-IDF weighted n-gram similarity; rewards distinctive, informative words |
| Paraphrase-tolerant / open-ended generation | BERTScore, BLEURT | Uses contextual embeddings to match synonyms and rewordings |
| Question answering | Exact Match (EM), F1 Score | EM for strict correctness; F1 for partial credit on token overlap |
| RAG retrieval quality | Context Precision, Context Recall | Measures whether retrieved chunks are relevant and cover the needed information |
| RAG generation quality | Answer Relevancy, Faithfulness | Ensures the answer addresses the question and stays grounded in retrieved context |
| Safety evaluation | Toxicity, Bias, Privacy Leakage, Jailbreak Robustness | Checks for harmful, biased, or unsafe model behavior |
| General-purpose quality | LLM-as-a-Judge | Scores output on correctness, helpfulness, completeness, etc. without needing reference texts |
🧠 Test Your Knowledge
References: