Statistical analysis and data exploration with R covering data wrangling, visualisation, and applying statistical methods to real-world datasets.
4 posts
-
 Data Science
Simpson's paradox
Simpson's paradox explained through UC Berkeley's 1973 admissions data, a trend that reverses when data is aggregated across groups.
-
 Data Science
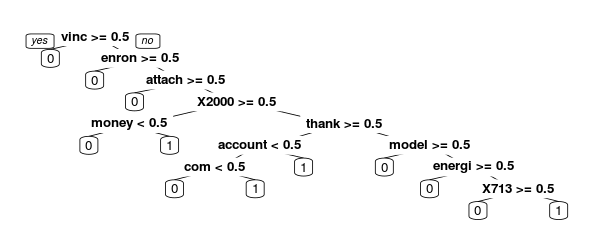
Email spam filtering: Text analysis in R
Building and evaluating an email spam filter using text analytics and machine learning in R.
-
 Data Science
Moneyball: Why no prediction can't be made for baseball champion
Using logistic regression in R to explore why ML cannot reliably predict the baseball World Series champion.
-
 Data Science
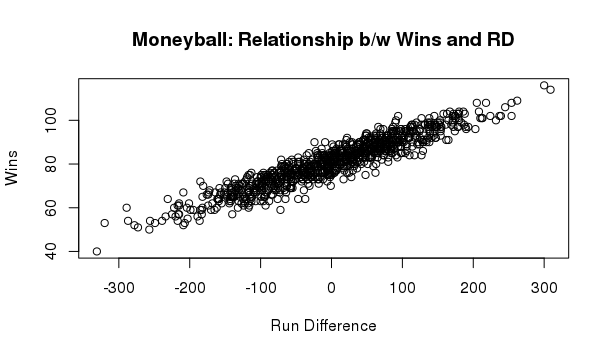
Moneyball: How linear regression changed baseball
How Oakland A's used linear regression in R to identify undervalued players and compete despite limited budget.