In 1973, the University of California, Berkeley was sued for gender bias against women who had applied to graduate schools. The data for fall 1973 showed that men applying were far more likely to get admits than the women.
But, after examining the individual departments, it appeared that no department was significantly biased against women.
It was a case of Simpson’s paradox1, a phenomenon in which a trend appears in different groups of data but disappears or reverses when these groups are combined.

Let’s analyze the UC Berkeley graduate admissions data of 1973. R comes preloaded with dataset2 UCBAdmissions.
# load in the data
> ucb = UCBAdmissions
# structure of the data
> str(ucb)
 table [1:2, 1:2, 1:6] 512 313 89 19 353 207 17 8 120 205 ...
 - attr(*, "dimnames")=List of 3
  ..$ Admit : chr [1:2] "Admitted" "Rejected"
  ..$ Gender: chr [1:2] "Male" "Female"
  ..$ Dept  : chr [1:6] "A" "B" "C" "D" ...
ucb is a three-dimensional table (like a matrix): Admit Status x Gender x Dept, with counts for each category as the matrix’s values. Here’s the data of six departments:
> ucb
, , Dept = A

          Gender
Admit      Male Female
  Admitted  512     89
  Rejected  313     19

, , Dept = B

          Gender
Admit      Male Female
  Admitted  353     17
  Rejected  207      8

, , Dept = C

          Gender
Admit      Male Female
  Admitted  120    202
  Rejected  205    391

, , Dept = D

          Gender
Admit      Male Female
  Admitted  138    131
  Rejected  279    244

, , Dept = E

          Gender
Admit      Male Female
  Admitted   53     94
  Rejected  138    299

, , Dept = F

          Gender
Admit      Male Female
  Admitted   22     24
  Rejected  351    317
Let’s check the acceptance rate of UC Berkeley in 1973 for graduate applicants.
> apply(ucb, c(1, 2), sum)
          Gender
Admit      Male Female
  Admitted 1198    557
  Rejected 1493   1278
> 1198/(1198+1493)
[1] 0.4451877
> 557/(557+1278)
[1] 0.3035422
Overall, women have an admission rate of 30.35%, which is much lower than that of men, 44.52%.
It prompted a lawsuit against UC Berkeley which prompted the study that collected this data.
Let’s draw mosaic plot3, which provides a way to visualize contingency tables.
> mosaicplot(apply(ucb, c(1, 2), sum), color=TRUE
+            main = "Student admissions at UC Berkeley")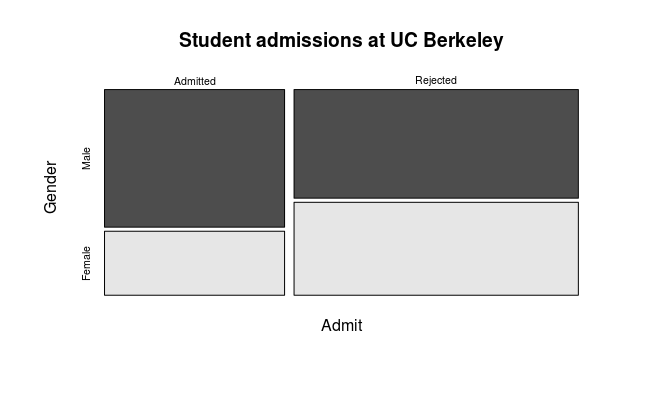
It seems to indicate a gender bias.
However, there is a lurking variable: Dept. Here is what happens if we stratify on department:
> plot(ucb, color=TRUE, main='Student admissions at UC Berkeley')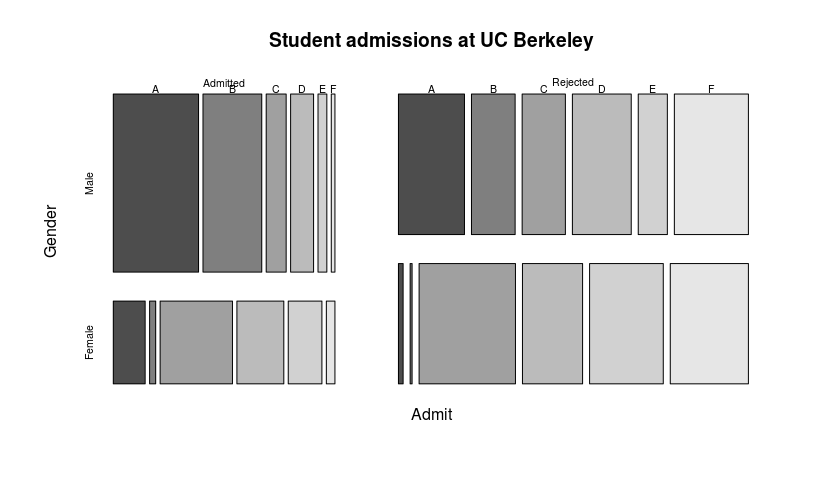
The Admit row in our table of contents corresponds to the width of columns in the mosaic plot. More people were rejected than admitted because Rejected column is wider. Of the people admitted, a much higher proportion were Male because of the height of the rectangles. Of the people rejected, it appears to be pretty even.
A higher proportion of admitted Males were for Dept A and B compared to the proportion of admitted Females for the same Dept. On the other hand, a higher proportion of admitted Females were for Dept C – F. But, higher proportion of the Males were rejected for Dept A and B than Females as the widths of the Male rectangles are wider than their Female counterparts. Likewise for Dept C – F, a higher proportion of the Females were rejected for Dept C – F than Males.
It appears that most departments have no gender bias, and those departments that are biased favor women. First, note that Dept A and B have very few female applicants (the columns are narrow). It is also relatively easy to get into those departments—the proportion rejected is lower than other departments, especially F. So one explanation is that more males get in because they are applying to the hungrier, perhaps fastest-growing, departments.
The research paper by Bickel et al.4 concluded that women tended to apply to competitive departments with low rates of admission even among qualified applicants (such as in the English Department), whereas men tended to apply to less-competitive departments with high rates of admission among the qualified applicants (such as in engineering and chemistry).
If you express matters algebraically, the appearance of the Paradox is no surprise.
For, suppose
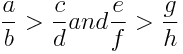
No one would dream of deducing that
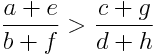
would they?
Footnotes:
1: Simpson’s paradox ↩
2: UCBAdmissions dataset ↩
3: Mosaic plot ↩
4: Research paper: Berkeley gender bias ↩
5: Image source
Comments