An outlier in our data can sometimes adversely affect our machine learning model. An outlier is any value that is distant from other observations in our data.
How to detect outliers: IQR?
First we must understand what Inter-Quartile Range (IQR) is. The Range (Max data point - Min data point) quantifies the variablity covered by ALL the data, while IQR measures the variablity of a distribution by giving us the range covered by the MIDDLE 50% of the data.
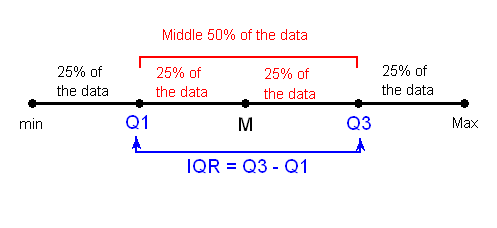
The middle 50% of the data falls between Q1 and Q3, and therefore: IQR = Q3 - Q1, the difference between the third and first quartiles. Q1, M and Q3 divide the data into four quarters with 25% of the data points in each, where Median (M) is essentially the second quartile.
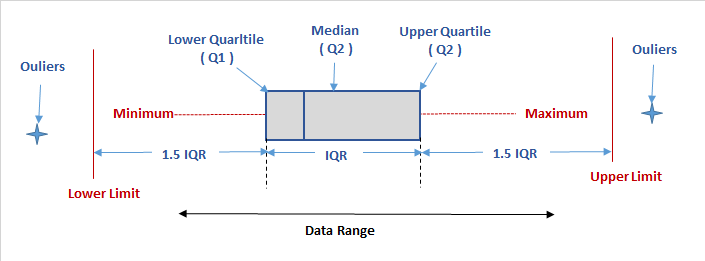
The IQR is used as the basis for identifying the outliers in the data.
An observation is considered a suspected outlier if it is:
- below
Q1 - 1.5(IQR)or - above
Q3 + 1.5(IQR)
An outlier can easily be detected using a boxplot1.
Let’s take an example:
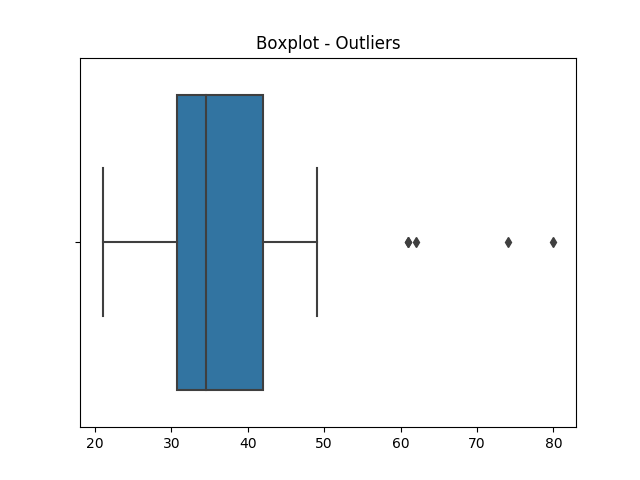
In the above example, the four observations right to the upper limit of boxplot are outliers.
Outliers == Out-liars?
The outliers may cause overfitting of our model as shown in the below example of Ames Housing dataset2:
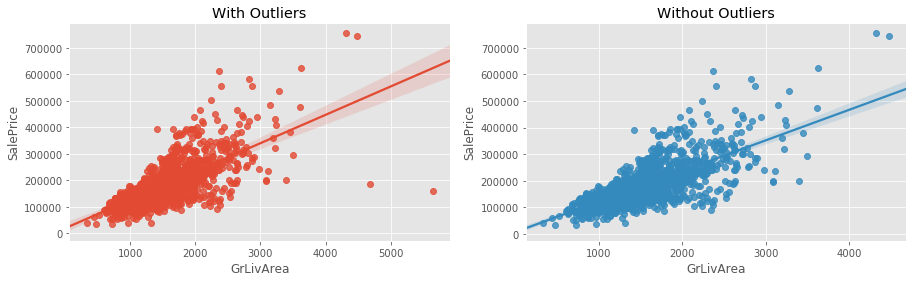
Removing the outliers (the high values below the line) increases confidence interval of the regression line.
Thus, outliers may give wrong impression of the data and sometimes prove to be a conundrum, so it must be taken care of.
Resources:
1: Box plot ↩
2: Ames Housing dataset ↩
Comments